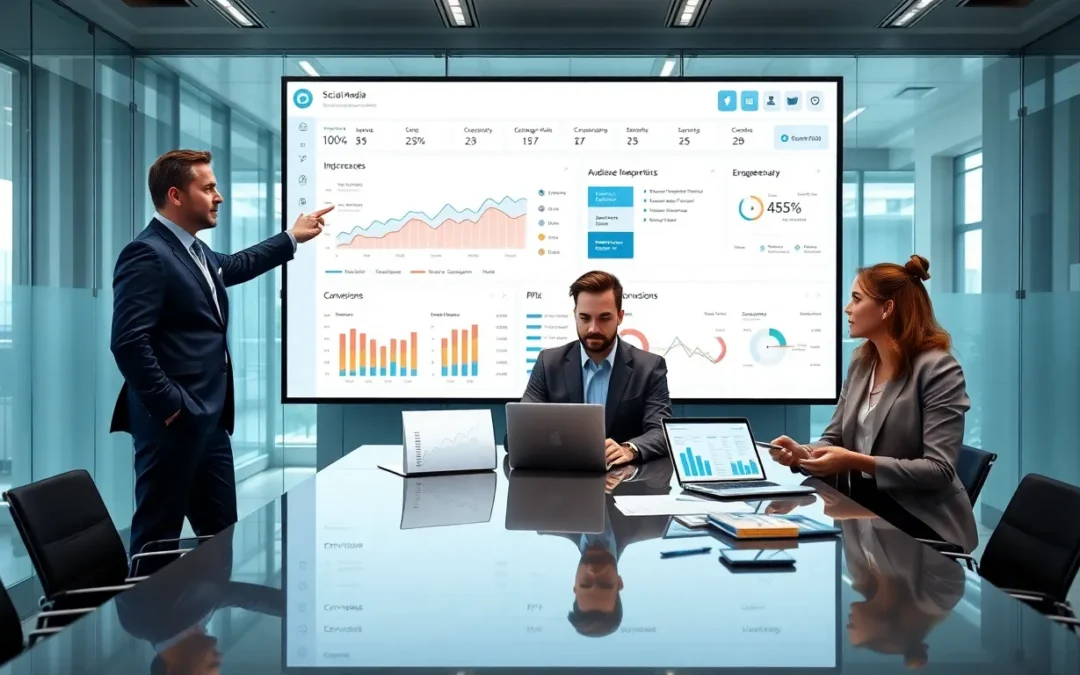
A social media reporting dashboard gives teams a single view of performance. It collects metrics, shows trends, and points to actions. Stakeholders use the dashboard to judge campaigns, allocate budget, and optimize content. This article lists core metrics, design choices, tools, cadence, and common mistakes for a social media reporting dashboard.
Key Takeaways
- A social media reporting dashboard becomes the single source of truth by consolidating platform data to save time and align teams around measurable outcomes.
- Include core metric groups—reach, engagement, conversions, and content performance—so the social media reporting dashboard reflects goals and guides actions.
- Design dashboards to surface top signals first, use clear visuals for trend spotting, and add slice-and-filter controls for fast analysis.
- Automate data collection and integrate platforms to reduce manual errors and make reporting repeatable and timely.
- Set reporting cadence and tailored views for each stakeholder to improve decision-making, avoid surprises, and increase dashboard adoption.
Why A Social Media Reporting Dashboard Matters
A social media reporting dashboard saves time and reduces confusion. It pulls data from platforms and shows results in one place. Teams see which content works and which content fails. Leaders use the dashboard to set goals and justify spend. Analysts use the dashboard to spot trends and test ideas. A clear dashboard keeps everyone aligned around measurable outcomes. Teams trust a dashboard that shows accurate, timely data. A social media reporting dashboard becomes the source of truth for performance decisions.
Core Metrics To Track
A social media reporting dashboard must include the following metric groups. Each group offers a different view of performance. Teams should pick metrics that match their goals.
Designing An Effective Dashboard
Design shapes how users read and act on data. The dashboard should show the most important signals first. Visuals should make differences easy to spot. Controls should let users slice data quickly. The following design choices drive clarity and use.
Tools, Integrations, And Automation
Tools and integrations determine how easily teams collect and sync data. Automation reduces manual work and error. The right setup makes reporting fast and repeatable.
Reporting Cadence And Stakeholder Alignment
The reporting cadence shapes how teams use the dashboard. Different stakeholders need different views and frequency. Clear cadence reduces surprise and improves decisions.
Common Mistakes And Best Practices
Teams should avoid common traps that reduce the dashboard value. Correct practice improves trust and adoption.